

Most households with a reverse osmosis system own a TDS meter. They hold it under the tap, see a reading in the 20 to 50 ppm range, and assume the system is doing its job. That assumption is understandable. It is also incomplete in ways that matter.
TDS, or total dissolved solids, is a measure of electrical conductivity. It gives a rough picture of how much mineral content remains in filtered water. What it does not reveal is whether your membrane is still rejecting contaminants at its rated efficiency, whether your carbon pre-filter has exhausted its chlorine capacity, or whether the water contains volatile organic compounds or certain heavy metals that carry no electrical charge and register nothing on a conductivity sensor.
Running a reverse osmosis filter without real water quality monitoring is similar to checking that your air purifier is switched on and calling the air clean. The device is running. Whether it is working is a different question.
What Water Quality Monitors Actually Track
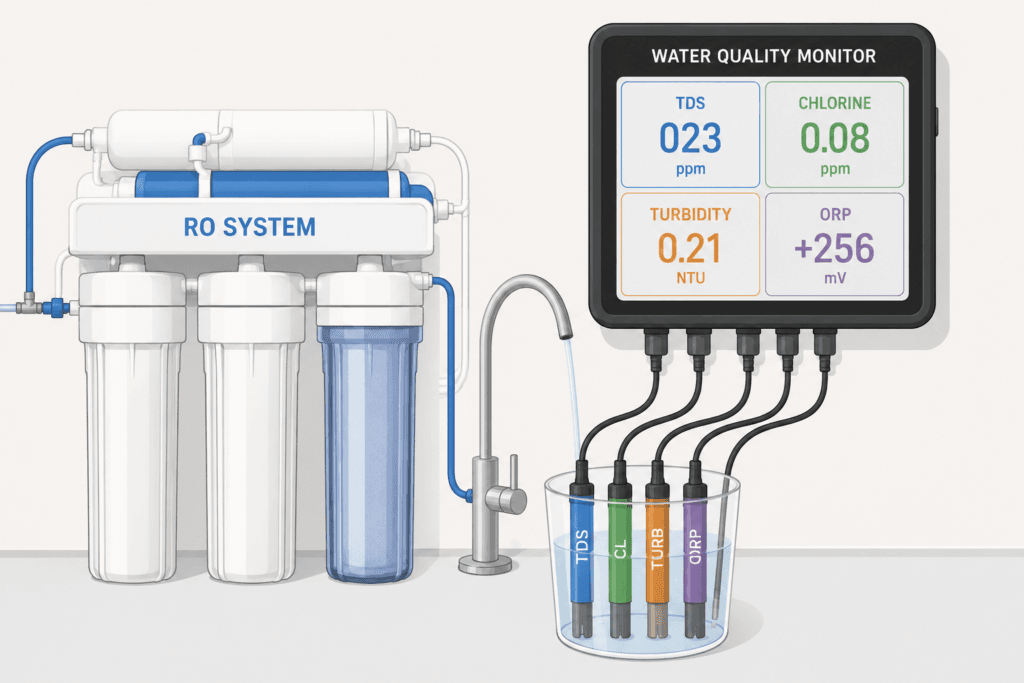
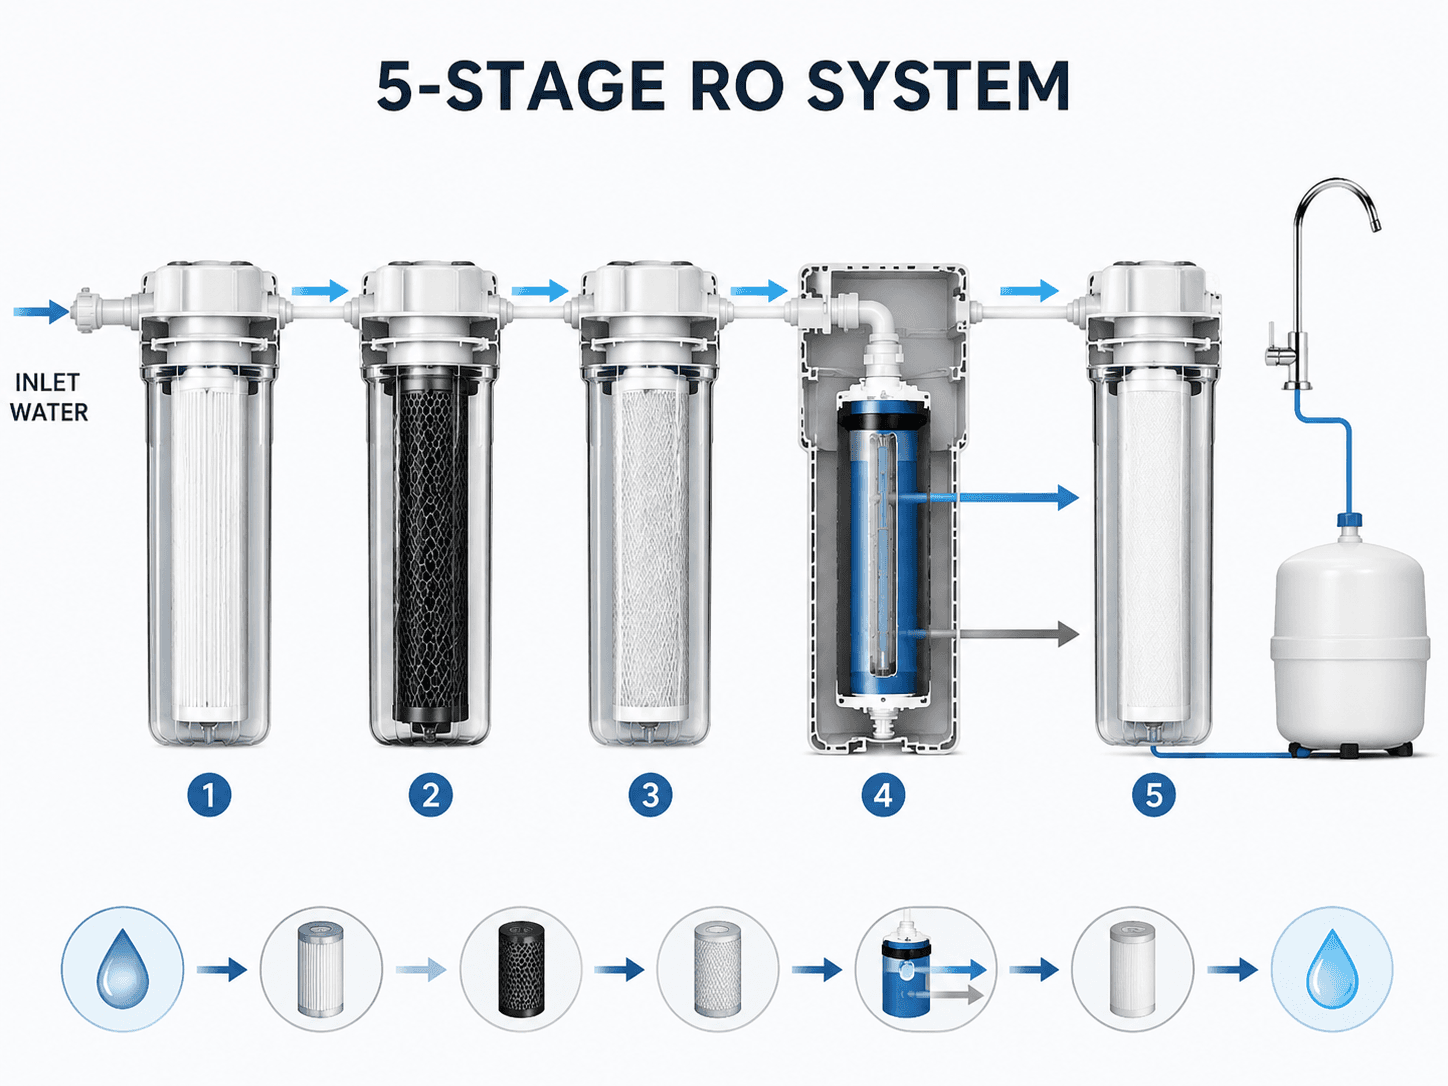
Consumer water quality monitors have expanded well beyond the single-sensor TDS pen. Multi-parameter devices now track several independent data streams simultaneously, and each one reflects a different part of the RO filter system.
| Parameter | What It Indicates | Sensor Type | Reference Threshold | RO Stage It Reflects |
|---|---|---|---|---|
| TDS | Total dissolved ions | Conductivity electrode | <50 ppm post-membrane typical | Membrane; late-stage indicator only |
| Free Chlorine | Residual disinfectant from municipal supply | Electrochemical / colorimetric | <0.1 mg/L post-carbon | Carbon pre-filter |
| Turbidity | Suspended particle load | Optical / nephelometer | <1 NTU post-membrane | Sediment pre-filter and membrane |
| ORP | Oxidative capacity; general water health | ORP electrode | +200 to +600 mV in treated water | Overall system health signal |
| pH | Acidity / alkalinity balance | Ion-selective electrode | 6.5–8.5 | Post-carbon mineral balance |
The key distinction here is the difference between a late-stage indicator and an early-warning signal. TDS creep, where the post-membrane reading drifts upward over months, is the most common proxy for membrane degradation. By the time TDS drift is noticeable, the membrane may already be operating well below its rated rejection efficiency. Free chlorine detection after the carbon stage, by contrast, gives a direct signal that the pre-filter protecting the membrane has exhausted its capacity. That is an early warning, not a post-failure confirmation.
Why RO Filter Degradation Is Invisible Without the Right Data
The set-and-forget problem in reverse osmosis systems follows a predictable pattern. A household installs an RO system, checks the initial TDS reading at commissioning, and considers the job done. Months later, the carbon pre-filter is past its recommended replacement window. Free chlorine is now reaching the membrane with every cycle. The membrane’s rejection rate has dropped from 97 percent to 88 percent. The TDS reading has moved from 28 to 43 ppm. That shift is easy to dismiss as normal variation.
The problem is that the WHO’s Guidelines for Drinking-water Quality sets maximum contaminant levels for specific compounds, including nitrates, arsenic, and lead, that are invisible to a conductivity meter. A membrane rejecting at 88 percent may be passing some of those compounds above guideline thresholds while the TDS reading stays in a range that looks acceptable. Nobody gets a warning. Nobody checks the carbon stage. The system keeps running.
Data point worth noting: a 2022 study published in Water Research found that thin-film composite RO membranes exposed to chlorinated feedwater showed measurable rejection decline beginning within 120 days of carbon pre-filter exhaustion, with rejection dropping from over 97 percent to below 90 percent before any corresponding TDS spike registered on standard conductivity meters. The gap between actual membrane failure and visible TDS signal averaged 6 to 11 weeks.
How RO Filter Performance Changes Over the Service Window
| Service Period | Pre-Filter Status | Membrane Rejection Rate | TDS Signal Visible? | Recommended Action |
|---|---|---|---|---|
| Month 1–3 | Full capacity | 97–99% | Stable baseline | Establish monitoring baseline |
| Month 4–7 | Approaching threshold | 95–97% | Minimal drift | Track free chlorine level post-carbon |
| Month 8–12 | Likely exhausted | 88–95% | Slight drift; easy to miss | Replace pre-filters; membrane at risk |
| Month 13+ | Exhausted; chlorine bypass | Below 85% | Noticeable TDS increase | Replace pre-filters and membrane |
The table above illustrates why the standard advice of replacing RO filters on a fixed calendar schedule exists: without monitoring, schedule is the only proxy available. With monitoring, you replace on evidence. The carbon pre-filter gets changed when free chlorine is detected post-stage, not when a sticker says so.
What to Look For in a Water Quality Monitor for RO Systems
Two points before comparing features. Consumer-grade water quality sensors are not laboratory instruments. They measure relative changes accurately and catch trend deviations early. For absolute contaminant confirmation against regulatory thresholds, a certified lab test is still the reference standard. That does not reduce their practical value, because continuous trend-tracking is exactly what day-to-day system monitoring is for.
Second, single-parameter TDS meters, which ship with most residential RO systems, are a starting point. They establish a baseline and flag late-stage membrane decline. A multi-parameter monitor that adds free chlorine, turbidity, and pH brings the monitoring picture close enough to actual filter performance to be genuinely useful at each stage.
Sensor placement matters as much as sensor type. An inline sensor installed between the carbon pre-filter stage and the membrane housing catches chlorine breakthrough before it reaches and degrades the membrane. A post-membrane inline sensor tracks TDS and turbidity as ongoing confirmation of membrane performance. The combination of both positions gives a complete picture of what each stage is contributing.
In homes where multiple appliances draw from the same supply line, including induction cookers with water reservoir functions, undercounter ice makers, and plumbed coffee machines, cumulative throughput accelerates pre-filter consumption faster than calendar-based replacement schedules anticipate. In those setups, continuous inline monitoring is substantially more reliable than periodic manual testing. For a connected approach to RO maintenance scheduling,
How a Monitoring Loop Makes RO Filtration More Than a Guess
Smart water quality monitoring reframes the entire reverse osmosis filter conversation. Instead of installing a system and hoping it performs, you are operating a closed loop: the monitor detects a chlorine spike or turbidity increase, the relevant pre-filter stage gets replaced, the membrane is protected and rejection rate is restored, and the monitor confirms the return to baseline. That loop is verifiable. A TDS pen checked once a month is not.
The broader market reflects this shift. The global water quality monitoring equipment market is projected to reach $5.4 billion by 2027, driven partly by post-pandemic awareness of what municipal water treatment guarantees at the point of use and partly by falling sensor hardware costs. Multi-parameter inline monitors that cost several hundred dollars four years ago are now widely available under $100. At this point, running a reverse osmosis system on TDS readings alone is the less informed choice.
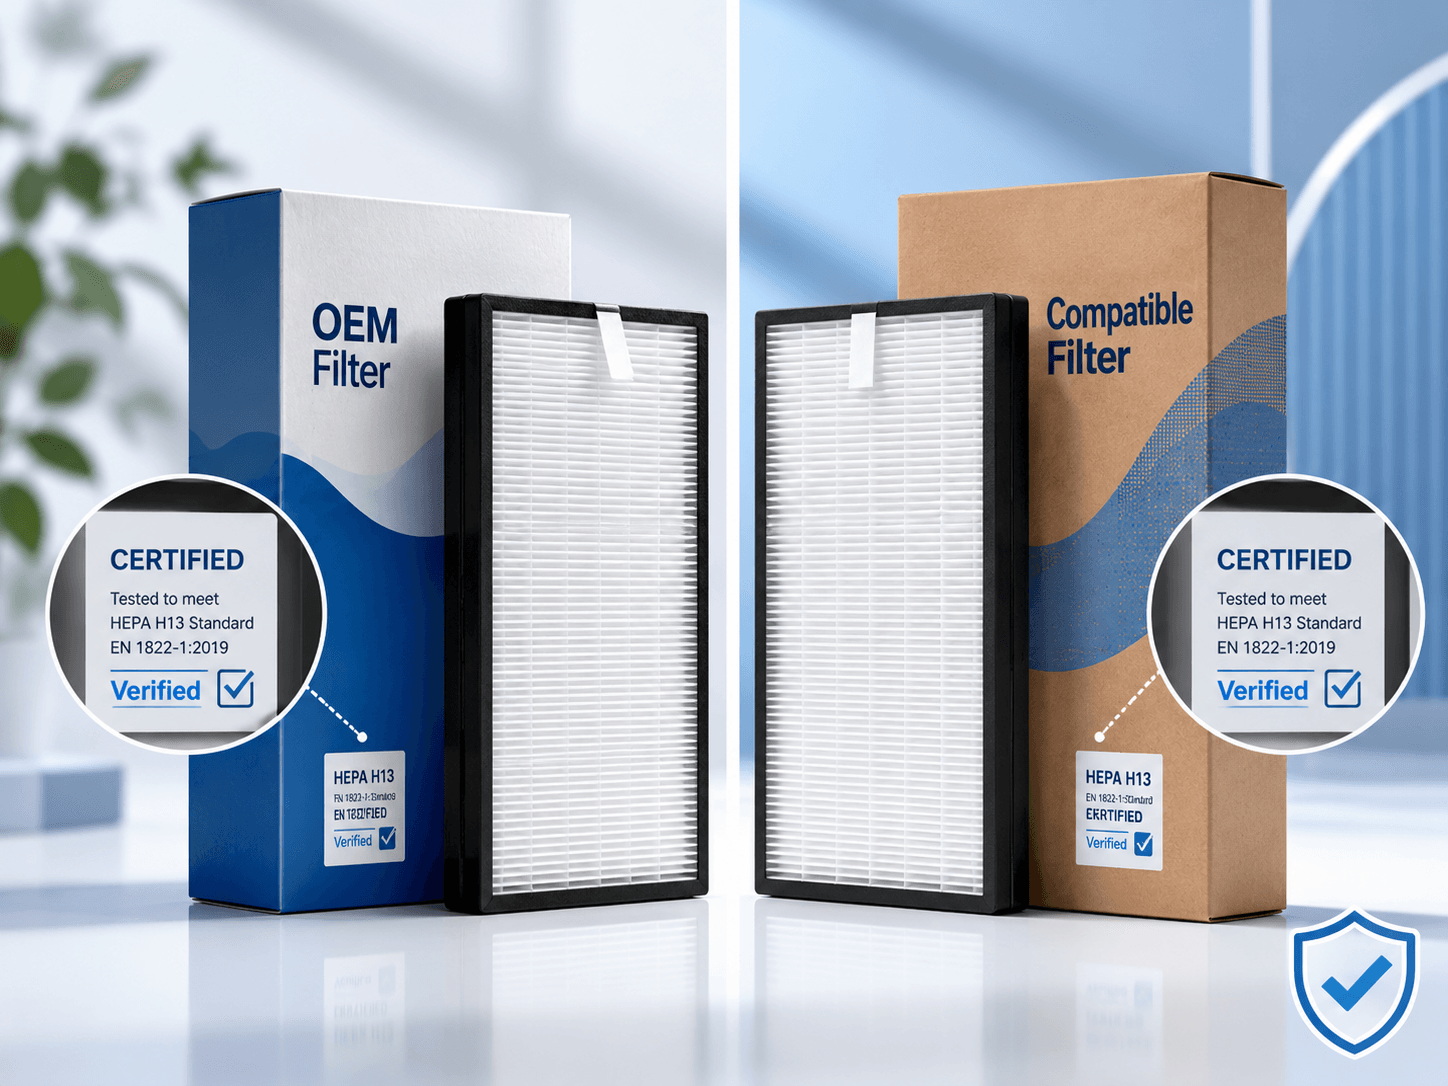
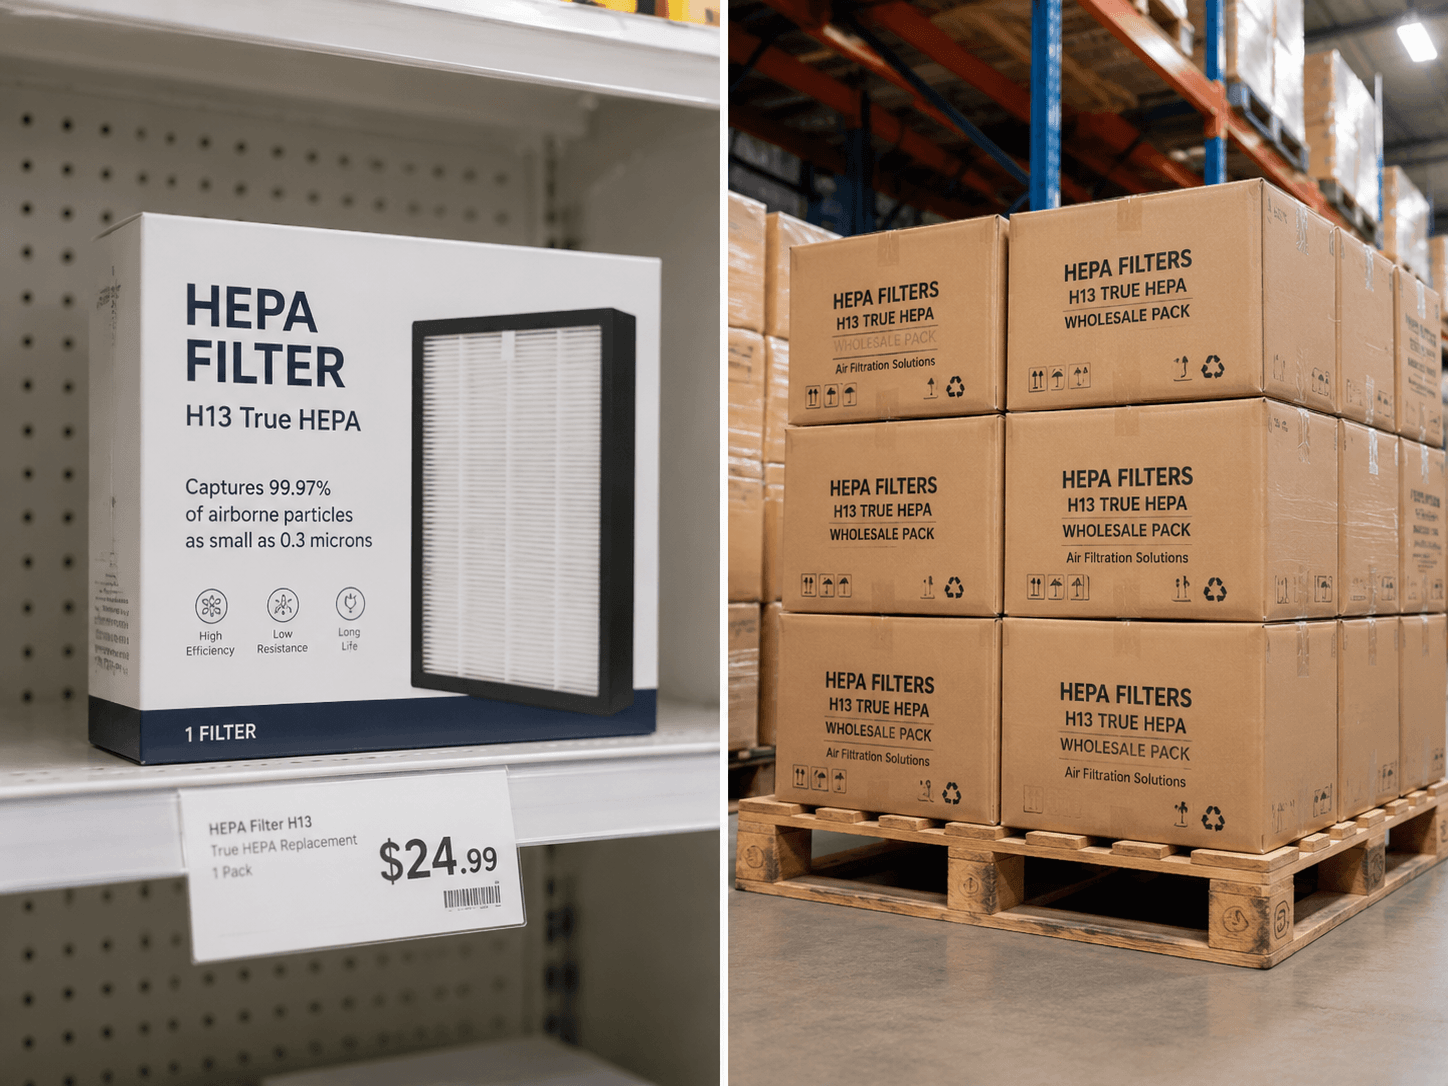
HIFINE manufactures filter media components for reverse osmosis systems, including polypropylene sediment pre-filter media and activated carbon block components, under ISO 9001 quality management. For wholesale and OEM reverse osmosis filter sourcing, visit our water filters section. For clients sourcing both water-side and air-side filtration components, our air purifier filters are produced under the same certified manufacturing process.